The cement industry is one of the strategic industries of Malaysia. It acts as the feeder to several other industries like real-estate, construction and infrastructure. The industry witnessed a period of subdued growth during 2006-10. However, cement consumption has grown in the last two years owing to the development of key infrastructure projects under the 10th Malaysia Plan and Economic Transformation Programme (ETP).
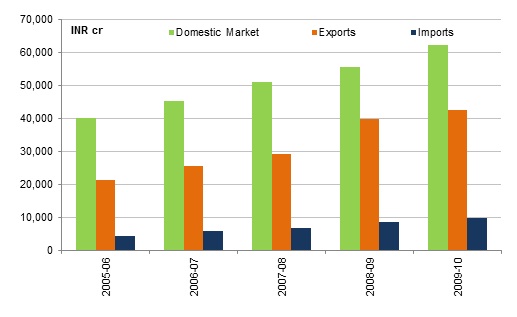
The recent growth in demand for cement is driving companies towards capacity expansion. By the end of 2013, the total installed capacity in Malaysia is expected to increase by around 25%. Many companies have commissioned new projects for enhancing their existing capacity. Around 80% of cement produced in Malaysia is consumed by the domestic market itself and the remainder is exported. Indonesia, Singapore and Sri Lanka are the major export destinations. Annual cement consumption recorded a growth of more than 5% y/y in 2012 backed by strong demand arising from residential and civil construction sectors.
The outlook for the Malaysian cement industry is positive backed by stable domestic demand and government support for infrastructure development under the 10th Malaysia Plan and ETP. The major challenges in front of the Malaysian cement industry are rising fuel prices and rising transportation costs. The industry will also have to meet global pollution and emission standards which will take considerable amount of investment.
Key Findings
- The Malaysian government has allocated MYR 230bn for development expenditure under the 10th Malaysia Plan (2011-15). The government has decided to invest substantive portion of the amount in developing infrastructure across the country.
- The recent growth in demand for cement is driving companies towards capacity expansion. By the end of 2013, the total installed capacity in Malaysia is expected to increase by around 25%. West Malaysia leads in terms of integrated production capacity accounting for around 90% of the existing capacity while East Malaysia accounts for 10%.
- During 2006-10, the annual cement consumption in Malaysia was stagnant and grew at a CAGR of only 0.5%. However, the industry has witnessed a steep demand recovery in the last two years. In FY12, the consumption grew by 5.9% y/y after growing by 6.3% y/y in FY11.
- Rise in cement demand has also led to increased imports of cement in the country. The ratio of imports as a percentage of total consumption rose to 20% in FY12. The major portion of imports predominantly came from China.

Chart: Per capita cement consumption trend in Malaysia (in kg)
Source: EMIS
This is just a quick glimpse into the EMD Report: Malaysia Cement Industry. Learn more now>>
Tags: 10th Malaysia Plan, Capacity, CIMA, CMS Cement, construction, Consumption, East Malaysia, Economic Transformation Programme, exports, GDP, Infrastructure., Lafarge Malaysia, Peninsula, Perak, production, residential, Tasek Corp, West Malaysia, YTL Cement, YTL Corp
Indonesia’s GDP grew by a robust 6.2% in 2012, driven by strong domestic consumption and investment. The Indonesian cement industry also witnessed high growth in capacity, consumption as well as production of cement. The country is the second-largest consumer of cement in ASEAN, with total cement consumption of 55mn tonnes by year end. However, it still lags behind its peers in terms of per-capita consumption.
Total cement production reached 52mn tonnes in 2012 while designed capacity grew to 60mn tonnes. Annual cement consumption grew by 14.5% in 2012 backed by strong demand from the housing and construction sectors. To cash in on this rising demand, leading cement companies have charted out aggressive expansion plans. As such, the country’s total designed capacity is expected to increase to 80mn tonnes by 2015.
The first five months of FY13 also reflected a similar trend with growth in both consumption and production of cement. However, cement consumption was disproportional to cement production in this period, highlighting the huge demand for cement in the country. Cement consumption touched 22.9mn tonnes in the January-May period while production lagged behind at 21.8mn tonnes.
The industry is dominated by three players who represent over 85% of total cement sales: Semen Indonesia, Indocement and Holcim Indonesia. The outlook for the Indonesian cement industry is positive, attributed to strong economic prospects as well as low current consumption per capita.
Key Findings
- Indonesia’s domestic cement consumption grew by 14.5% to 55mn tonnes in 2012, making it the second-largest cement industry in the ASEAN region.
- Total designed capacity is expected to reach 80mn tonnes by 2015 in line with demand growth, up from the current 60mn tonnes.
- Total cement exports have declined significantly over the last few years owing to a surge in domestic demand. In 2012, total exports plunged 84%.
- Semen Indonesia is the leader in terms of sales, designed capacity and production. In 2012, the company had a 41% domestic market share based on sales volume. It was followed by Indocement and Holcim with a share of 32% and 15%, respectively.

Much more in the EMD report: Indonesia Cement Industry>>
Tags: ASEAN, bag, bulk, Capacity, cement, Concrete, construction, Consumption, exports, GDP, Holcim Indonesia, Housing, imports, Indocement, Indonesia, Infrastructure., islands, Java, Kalimantan, prices, production, sales, Semen Andalas, Semen Baturaja, Semen Bosowa Marus, Semen Indonesia, Sumatera, SWOT analysis
The Polish retail market maintained an upward y/y path in 2012, though sales slowed down visibly in Q4. The situation varied across segments, but overall the increase of market value was supported by the expansion of the large retail chains, which managed to offset the downward impact of a sluggish demand upon sales per store by the network enlargement (higher volumes).
The prospects for this year remained optimistic, considering the record-high shopping center deliveries planned, even though consumer demand will likely continue to deteriorate, paralleling the projected slowdown of the country’s economy.

Figure 1 Retail sales index in 2007-2013 (monthly, y/y in %)
These are only a few of the insights in the new Intellinews Report : Polish Retail Sector. Learn more and purchase now>>
Tags: abc, Abra, Avans, Biedronka, Black Red, Carrefour, CCC, clothing, construction materials, cosmetics, DIY, E.Leclerc, electronics, Farmacol, footwear, Forte, GDP, Gino Rossi, Griffin Topco, growth, hypermarkets, Ikea, inflation, Jysk, Komputronik, LPP, Media Expert, Media-Saturn Holding, Monnari, NeoNet, Netto, Neuca, Pelion, pharma, Poland, Poles, Polomarket, Prochnik, Redan, retail, Rossman, sales, Spar, supermarkets, unemployment, Vistula, Wojas, Zabka
The construction and assembly index dropped by 1% y/y in 2012, marking a negative growth after the double-digit annual advance recorded in 2011. After a good performance in H1, the situation in the sector deteriorated abruptly in H2/2012 as infrastructure spending, the main growth driver in the past few years, was expected to fall with the completion of the main road building projects ahead of the Euro 2012 soccer championship.
The construction sector is expected to face challenges in 2013 and the coming years as well, particularly on the public building segment, but the outlook for the sector is not entirely gloomy, as the lowering demand from infrastructure can be replaced by alternatives in sectors such as rail and energy. However, overall the construction sector is expected to see visible recovery only in 2015, when EU co-financed projects for 2014-2020 are launched.

Figure 1 Constructions sector – Selective indicators in 2005-2012 (annual, y/y)
Much more in the Intelinews report: Polish Construction Sector
Tags: bankrupticy, Budimex, building, civil engineering, construction, economy, employment, energy, environment, gas, GDP, homes, Housing, Infrastructure., Insolvent PBG, M&A, office, oil, PBG, permits, Pol –Aqua, Poland, Polimex-Mostostal, Polish, rail, retail, sector, sentiment, Skanska, Strabag, Warbud, warehouse
The textile and garment industry is an important contributor to Indonesia’s economy, serving as a large source for jobs and export earnings. Being the largest textiles and apparel producers in the region, it has a long tradition of producing and exporting ready-made garment and home- fashion textiles.
Exports of manufactured goods reached USD 22.63bn in 2012, a decrease of 11.19% year-on-year. The export value of textile yarns, fabrics, and made-up articles reached USD 4.55bn in 2012, down 5.02% from USD 4.79bn a year ago. Meanwhile, the textile, leather products and footwear sectors combined were the fourth largest contributor to the manufacturing industry with a market share of 9.81% for the quarter ending December 2012.
Textile companies across north Asia, especially from South Korea, Taiwan and China, have been making significant investments in Indonesia with the aim of exporting to their home country. These foreign entrants are anticipated to boost total investment in the textile industry to about IDR 6tr (USD 702mn), according to Ade Sudrajat, Chairman of the Indonesian Textile Association.
Salient Points
- The textile, leather products and footwear sectors combined were the fourth largest contributor to the manufacturing industry with a market share of 9.81% for the quarter ending December 2012.
- The export value of textile yarns, fabrics, and made-up articles reached USD 4.55bn in 2012, down 5.02% from USD 4.79bn a year ago.
- Imports of clothing registered a staggering growth of 47.88% year-on-year in 2012. The figures in 2012 were more than doubled the USD268.88mn recorded in 2009.

Souce: CEIC
This is just a quick glimpse into the EMD Report: Indonesia Textile & Garment Industry. Learn more and purchase now>>
Tags: apparel, article of apparel, clothing, CPI, development, economic indicators, employment, Eratex, Ever Shine, export, fabrics, financial highlights, garment, GDP, GNP, gross domestic product, gross national product, growth rate, import, Indonesia, Industrial Production, investment, IPI, machinery, made up articles, manufactured goods, manufacturing, Pan Brothers, performance, restructuring, SWOT, textile, textile articles, value, volume, yarns
Commercial property investments in Romania surged by 32% in 2011 – C&W.
Investments in commercial property in Romania surged by 32% y/y to USD 425mn in 2011, according to data from Cushman & Wakefield. Investment activity in 2012 is expected to increase further. The prime yield in the office and retail property sector stood at 9% and at 9.5% in the industrial property sector last year
Commercial property investments in Serbia plunge 38.1% in 2011 – C&W.
Investments in commercial property in Serbia plunged by 38.1% y/y to USD 88mn in 2011, according to data from Cushman & Wakefield. Investment activity in 2012 is expected to stay as in 2011.
Commercial property investments in Croatia down 13.6% in 2011 – C&W.
Investments in commercial property in Croatia fell by 13.6% y/y to USD 289mn in 2011, according to data from Cushman & Wakefield. Investment activity in 2012 is expected to stay the same as in 2011. The prime yield in the office sector was 8%, the retail sector stood at 7.75% and the industrial property sector at 9.50%.
Investments in commercial property in Bulgaria skyrocketed 916.34% y/y to USD 257mn in 2011, according to data from C&W. Investment activity in 2012 is projected to remain flat. The prime yield in the office and retail property sector stood at 11% and at 9.5%; in the industrial property sector at 12% and the outlook for 2012 hints growth.
Romania was the largest market for new commercial property investments in SEE, according to the Cushman & Wakefield report International Investment Atlas Summary 2012. The other SEE countries for which data was available were Bulgaria, Croatia and Serbia. Commercial property investments in Romania totalled USD 425mn in 2011, which was 32% more than in 2010. Croatia ranked second although it had dropped compared to 2010. The third biggest market, Bulgaria, registered a 916.3% growth, the highest among all countries included in the report. Serbia was the region’s least attractive market with investments plunging by 38.1%.

These are only a few of the insights in the new Intellinews Report : SEE Construction and Real Estate Report. Learn more and purchase now>>
Tags: ADF, Albania, apartments, Azvi, Bosnia Herzegovina, bridge, building, Bulgaria, business, completed housing, construction, cost, Croatia, demand, GDP, growth, HAC, investment, loan, Macedonia, market, Moldova, Montenegro, motorway, office supplies, Orascom, permits, price, property, railway, real estate, Romania, sales, Serbia, Slovenia, supply, Tirana
India Pharmaceutical & Healthcare provides an overview of the industry in Asia Pacific and India. India’s pharmaceutical industry grew by 9.7% year-on-year in 2009-10, largely due to robust growth in its domestic market. India’s healthcare industry is expected to grow 14% per year to reach USD 280 billion by 2020. Exports of drugs, pharmaceuticals and fine chemicals accounted for approximately 4.20% of the total national exports in 2010-11.
The report includes the market trends and outlook for the pharmaceutical and healthcare industries in India. We examine the country’s generic production, healthcare equipment, government schemes, TRIPS Compatibility, R&D initiatives, Pharmaceutical Export Promotion Council and India’s Vision 2015.
Also, the report encompasses the profile of leading players in the industry as well as their financial highlights and SWOT analysis. Among the leading players are Ranbaxy, Dr Reddy’s, Cipla and Lupin. Ranbaxy is India’s largest pharmaceutical company with operations in 23 of the top 25 pharmaceutical markets of the world.
Key Findings
- India’s pharmaceutical industry grew by 9.7% year-on-year in 2009-10, largely due to robust growth in the domestic market.
- India’s healthcare industry is expected to grow 14% per year to reach USD 280 billion by 2020.
- According to government statistics, exports of drugs, pharmaceuticals and fine chemicals throughout 2010-11 stood at INR 47,551 cr after a robust growth of 12.0% over 2009-2010.
India Pharmaceutical Sector
Source: Department of Pharmaceuticals
These are only a few of the insights in the new EMD Report : India Pharmaceutical Industry. Learn more and purchase now>>
Tags: Asia-Pacific, Bengal Chemicals and Pharmaceuticals, Bengal Immunity, bulk drugs, Cipla, Dr Reddy’s, drug prices, equipment, export, FDI, FICCI, formulation packs, GDP, generic drug, government schemes, health statistics, healthcare, Hindustan Antibiotics, import, India, Indian Drug and Pharmaceuticals, investments, Lupin, medicinal, NIPER, NPPA, patent, pharmaceutical, pharmaceutical trade, pharmaceutical units, Pharmexcil, PSU, public sector undertakings, R&D initiatives, Ranbaxy, Smith Stanistreet Pharmaceuticals, TRIPS, US FDA
As a whole, the banking sector across the CEE region remains profitable. Interest margins have tightened recently, but are still much higher than in Western Europe. Lending growth has softened and banks have increasingly focused on attracting fundings from domestic sources, increasing competition for deposits. Western European banks, which hold more than two thirds of the CEE banking sector’s assets, have withdrawn significant amounts of parent funding, pressured by heightened capital requirements in their home countries, but are believed to remain committed to the region, which has a strong growth potential. The main weakness of the CEE banking sector is the high level of bad loans and the trend for further worsening of the asset quality in view of the weak economic environment.
Much more in the Intellinews report: CEE Banking Sector Report
Tags: Bank for Reconstruction and Development (EBRD), Bank of Lithuania, banking, banks, Bulgaria, CEE, clients, credit institutions, Croatia, Czech Republik, deposits, domestic deposit, domestic loan, Estonia, European Investment Bank, foreign corporations, GDP, Germany, Goldman Sachs, Hungary, Latvia, lending, Lithuania, macroeconomy, MFI loans, National Bank of Poland (NBP), nn-performing loans, NPL ratio, Poland, Romania, Slovakia, Ukraine, UniCredit Bulbank
Romania’s public debt edged up a modest 0.1pps ytd to 34.8% of GDP [ESA methodology] at the end of October 2012 – after it nearly tripled since the end of 2008. The domestic public debt expanded sharply by more than three times while the external public debt advanced at a slower pace yet still more than doubling. Notably however, a large part of the domestic debt is denominated in foreign currency – actually more than half of it [54.8% at the end of October].

Romania public debt
Much more in the EMD report: Romania Country Report
Tags: bank, BCR, budget, constructions, debt, deficit, deposit, EBRD, fiscal, Fitch, forecasts, foreign, Forex, forex reserves, GDP, government, industry, inflation, insurance, JP Morgan, labour, loan, market, politics, prices, profit, real sector, retail, Romania, sales, spending, stock, unemployment, wages
SG Healthcare provides an overview of the healthcare industry in Singapore and the Asia Pacific. Singapore’s healthcare system is internationally recognized and was ranked 6th out of 191 countries and 1st in Asia in the World Health Report on health systems, hence allowing the country to be well poised to benefit from global trends. In 2011, Singapore’s healthcare services industry had more than 4,300 establishments with about 69,000 employees working in the industry.
The report includes the market trends and outlook of the healthcare industry in Singapore. We examine the financing approach of Singapore’s healthcare industry, medical tourism as well as other initiatives undertaken by the government to improve its healthcare industry. According to the Singapore Tourism Board, Singapore earned SGD 940 million from medical tourism in 2010, a whopping SGD 200 million increase from a year ago.
Also, the report encompasses the profile of leading players in the healthcare industry as well as their respective financial highlights. Among the leading healthcare players in Singapore are Parkway Pantai Limited, Thomson Medical Centre Limited, Health Management International Limited and China Healthcare Limited. Parkway is the largest healthcare provider in Singapore and one of the largest in Asia.
Key Findings:
- In 2011, Singapore’s healthcare services industry had more than 4,300 establishments with about 69,000 employees working in the industry.
- According to the Singapore Tourism Board, Singapore earned SGD 940 million from medical tourism in 2010, a whopping SGD 200 million increase from a year ago.
- Going forward, Asia and Latin America are projected to lead the growth in the global pharmaceutical industry.
Chart 3: Social Development in Healthcare Industry

Source: Department of Statistics
Learn more from our EMD report: Singapore Healthcare Industry 2H12
Tags: 3M, acute care, admissions, Asia-Pacific, attendances, bill size, CCI, China Healthcare, clinics, cost, day surgeries, dental, economy, EDB, eldershield, establishments, extended care, financing, GDP, Gleneagles, gynecology, Hanh Phuc Hospital, healthcare, healthcare services, healthcare workers, HMI, Hospital, HPB, IHH, inflation rate, inpatient, JCI, life expectancy, market size, medical centre, medical specialties, Medical Tourism, medical treatment, medicine, medifund, medisave, medishield, MOH, Mount Elizabeth, NEHR, net profit, non-western, obstetrics, outpatient, Pantai, pharmaceutical, polyclinics, population, private, privatisation, public, purchasing power, revenue, Singapore, SingaporeMedicine, social development, SPBA, Thomson, TMC, western


