During the last five years, the Indian cement industry has shown resilience even amidst the global financial crisis. It is one of the eight core industries of the Indian economy. As of 2012, India was the second largest producer of cement in the world behind China. There has been a surge in capacity, consumption as well as production of cement during the last five years. However, per capita cement consumption in India is still amongst the lowest in the world. The vast potential that exists in the industry has attracted investors from all round the world. Three of the top four cement producers of the world have an established presence in India.
India’s cement industry witnessed growth even amidst a grim economic situation in the country in FY13. The demand supply gap that existed in the sector has allowed the cement companies to stay profitable. Housing and government spending on infrastructure were the major drivers of growth for the industry. Although the installed capacity has increased in the past few years, the cement companies of India were not able to utilize it to full extent. The industrial slowdown and consequent moderation in demand for cement resulted in a lower capacity utilization for the industry in the last four years. Furthermore, the rising cost of production brought the operating margins of Indian cement companies under pressure at the end of FY13.
However, the long term outlook for Indian cement industry is positive owing to a steady growth in housing and infrastructure development. Domestic consumption is expected to drive growth and expansion in the industry.
Key Findings
- Government spending on infrastructure has been a major source of growth for the sector. As of FY12, the investment in infrastructure was at 8.37% of GDP. This figure is projected to grow to 10.70% of GDP by the end of 12th Plan period (2012-17).
- During 2006-12, the annual cement consumption in India grew at a CAGR of 10%. In FY13, the consumption grew by 9.5% y/y, recording a recovery after witnessing a tepid 7.1% y/y growth in FY12. Government spending was one of the main drivers of this recovery.
- During 2008-13, the country’s installed production capacity increased at a CAGR of 12.1%. However, the addition in capacity did not result in a corresponding increase in production and demand. Hence, the industry’s capacity utilization has declined in the last four years.
- During 2008-13, the production index for eight core industries recorded a CAGR of 4.9%. Cement industry outperformed the overall growth by recording a CAGR of 7.6% during the same period. In FY13 too, while the overall production index recorded a 1% y/y growth, cement industry recorded a y/y growth of 9%.

Chart: Y/Y change in Index of industrial production (Base 2004-05=100)
Source: Ministry of Statistics and Program Implantation (MOSPI)
These are only a few of the insights in the new EMD Report : India Cement Industry. Learn more >>
Tags: ACC, Ambuja, Capacity, Consumption, Core, demand, Department of Industrial Policy and Promotion (DIPP), export, government, Holcim, Index of Industrial Production (IIP), India Cements, Infrastructure., Margin, Ministry of Commerce and Industry, Per capita, Planning Commission of India, prices, private, production, Realization, Region, Shree Cements, UltraTech, WPI
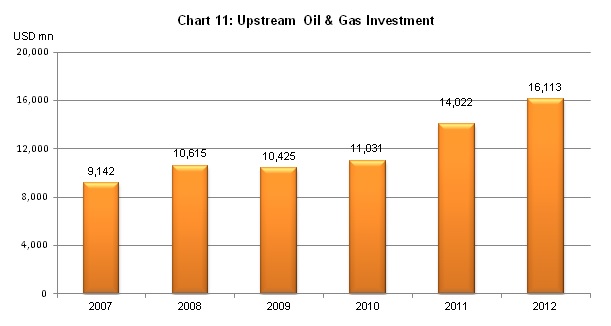
Indonesia has been active in the oil and gas industry for over 120 years after the country’s first oil discovery in North Sumatra back in 1885. The number of domestic exploration and production working areas in the upstream industry increased from 107 units in 2002 to 308 units by the end of 2012, as a result of industry investments of about USD 21.3bn in 2012.
Indonesia has become a net importer of oil largely due to maturing fields and rising local demand. In the first quarter of 2013, Indonesia incurred a deficit of USD 3.36bn in oil and gas trading. The country exported USD 8.15bn worth of oil and gas, but imported USD 11.51bn during the same period.
Indonesia had 0.2% of the world’s proven oil reserves at approximately 3.7bn barrels by the end of 2012. Natural gas reserves of the country stood at 2.9 trillion cubic meters in 2012, representing 1.6% of the world’s total reserves. In 2012, Indonesia produced approximately 2.1% of the global natural gas.
Key Findings
- In 2012, approximately USD 16.11bn was invested in the upstream oil and gas industry. Investment in production and development accounted for 64.36% and 20.41%, respectively.
- The number of domestic exploration and production working areas for the upstream industry increased from 107 in 2002 to 308 by the end of 2012.
- Indonesia has identified floating storage and regasification unit (FSRU) as a strategic asset to meet the country’s rising demand of gas.
- Indonesia aims to achieve 500 mmscfd of gas from coalbed methane by 2015 and 1,500 mmscfd by 2025.
Source: SKKMigas
Much more in the EMD report: Indonesia Oil & Gas Industry>>
Tags: BHPMigas, BPMigas, coalbed methane, Crude oil, daily production, downstream, Elnusa, Energi Mega, export, FSRU, gas, import, Indonesia, LNG regasification, Medco Energi, Ministry of Energy and Mineral Resources, Natural Gas, Nusantara Regas Satu, oil, PGN, PT Pertamina, PT Perusahaan Gas Negara Tbk, Radiant Utama, SKKMIGAS, upstream
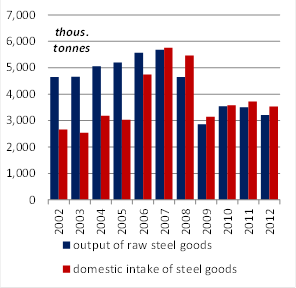
Romania’s crude steel output increased gradually from 5.5mn tonnes in 2002 to nearly 6.3mn tonnes in 2006-2007. It further plunged to below 2.8mn tonnes in 2009 amid deep recession and inventory effects, but returned meanwhile and has stabilised to around 3.7-3.8mn tonnes in 2011-2012.
The output of raw steel goods followed a similar pattern and stabilised around 3.2-3.5mn tonnes [2012 data is still not final – the 8.3% y/y decline calculated by us for the year might have been lower].
What has essentially happened is that local steel mills stopped producing raw steel goods for export – since this business model is now no more cost-effective.
These are only a few of the insights in the new Intellinews Report : Romania Iron and Steel . Learn more and purchase now>>
Tags: Arcelormittal, development, export, forecast, foreign trade, import, industry, iron, Lakshmi Mittal, market, MECHEL, prices, production, Romania, sales, Steel, TMK, utilization
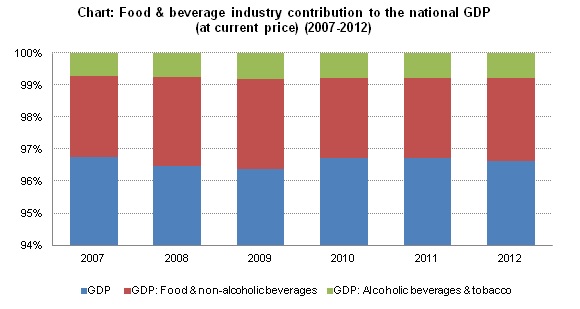
Singapore’s food and beverage (F&B) services industry contributed approximately SGD 11.98bn or 3.5% to the country’s total GDP in 2012. On a per capita basis, Singapore has the highest food consumption levels in Southeast Asia, accounting for 3% of GDP. Due to limited domestic agricultural production and rapid urbanisation, the country imports more than 90% of its food products, particularly from other Asian countries. Imports of F&B account for over 8% of GDP in 2012.
Expenditure on F&B has grown steadily in Singapore, with market value expanding from around SGD 9bn in 2007 to SGD 12bn in 2012. The rise in the number of working women, growing middle class population and the surge in disposable income were the main drivers of this growth.
Going forward, the country’s F&B industry is expected to witness robust growth thanks to highly promising per capita consumption growth. Food retail, which currently represents 40% of the total retail spending in Singapore, is expected to increase due to higher incomes and rising visitor arrivals.
Key findings
- Singapore’s F&B industry contributed around SGD 12bn or 3.5% to the country’s total GDP in 2012. The rise in the number of working women, growing middle class population and the surge in disposable income have contributed to the expanding F&B market.
- On a per capita basis, Singapore has the highest food consumption levels in the Southeast Asia region. The country’s food consumption was estimated to reach USD 7.7bn in 2012, accounting for 3% of GDP.
- Restaurants contributed a significant 36% of the total 6,500 establishments in the F&B industry in 2010. They were the largest employer, employing some 37,500 workers or an average of 16 workers per establishment.
This is just a quick glimpse into the EMD Report: Singapore Food & Beverage Industry
Tags: APB, beverage, comparative matrix, consumer preferences, Consumption, CPI, establishments, expansion strategies, expenditure, export, F&N, food, Food Empire, health food, IIP, import, leading players, manpower, manufacturing, market value, OLAM, operating receipts, Petra Foods, prices, regulations, retail, services, Singapore, size, standards, trends
The textile and garment industry is an important contributor to Indonesia’s economy, serving as a large source for jobs and export earnings. Being the largest textiles and apparel producers in the region, it has a long tradition of producing and exporting ready-made garment and home- fashion textiles.
Exports of manufactured goods reached USD 22.63bn in 2012, a decrease of 11.19% year-on-year. The export value of textile yarns, fabrics, and made-up articles reached USD 4.55bn in 2012, down 5.02% from USD 4.79bn a year ago. Meanwhile, the textile, leather products and footwear sectors combined were the fourth largest contributor to the manufacturing industry with a market share of 9.81% for the quarter ending December 2012.
Textile companies across north Asia, especially from South Korea, Taiwan and China, have been making significant investments in Indonesia with the aim of exporting to their home country. These foreign entrants are anticipated to boost total investment in the textile industry to about IDR 6tr (USD 702mn), according to Ade Sudrajat, Chairman of the Indonesian Textile Association.
Salient Points
- The textile, leather products and footwear sectors combined were the fourth largest contributor to the manufacturing industry with a market share of 9.81% for the quarter ending December 2012.
- The export value of textile yarns, fabrics, and made-up articles reached USD 4.55bn in 2012, down 5.02% from USD 4.79bn a year ago.
- Imports of clothing registered a staggering growth of 47.88% year-on-year in 2012. The figures in 2012 were more than doubled the USD268.88mn recorded in 2009.

Souce: CEIC
This is just a quick glimpse into the EMD Report: Indonesia Textile & Garment Industry. Learn more and purchase now>>
Tags: apparel, article of apparel, clothing, CPI, development, economic indicators, employment, Eratex, Ever Shine, export, fabrics, financial highlights, garment, GDP, GNP, gross domestic product, gross national product, growth rate, import, Indonesia, Industrial Production, investment, IPI, machinery, made up articles, manufactured goods, manufacturing, Pan Brothers, performance, restructuring, SWOT, textile, textile articles, value, volume, yarns
Following rapid growth in the past few years, the Malaysian palm oil industry experienced unprecedented lower productivity in 2012 with lower crude palm oil (CPO) production, as well as lower palm oil prices and exports. The average CPO price for the year slipped 14% to MYR 2,764 per tonne from a record-high of MYR 3,219 per tonne in 2011, while export revenue for palm products declined 11% to MYR 71.5bn.
CPO production in 2012 declined marginally to 18.79mn tonnes, attributed to lower fresh fruit bunch (FFB) yield due to tree stress after a strong FFB production period in 2011. Higher palm oil opening stocks, higher imports by 6.5% and lower palm oil exports by 2.4% contributed to the huge closing stocks for the year. Meanwhile, the oil palm planted area in 2012 increased 1.5% to 5.08mn hectares due to increase in planted area in Sarawak.
Effective Jan 1, 2013, Malaysia lowered its CPO export tax rates to create a level playing field vis-à-vis its Indonesian peers and provide an export outlet for the huge stockpiles. The government has also shown keen interest in subsiding oil palm replanting scheme and raising domestic demand for palm biodiesel to prevent escalating stockpile. CPO prices are envisaged to stage a modest recovery in 2013, barring any changes to the global economic recovery.
Salient points
- Palm oil stocks in 2012 closed at record-high 2.63mn tonnes, a surge of 27.7% y/y. Higher palm oil opening stock and imports as well as lower palm oil exports contributed to the huge closing stocks.
- The average CPO price in 2012 was MYR 2,764, down 14.1% against record-high MYR 3,219 in 2011, mainly due to concerns over the build-up in palm oil stocks.
- The average FFB yield decreased 4.1% to 18.89 tonnes per hectare in 2012 after experiencing a year of high yield, while the national oil extraction rate (OER) remained steady at 20.35%.

Source: MPOB
Much more in the EMD report: Malaysia Palm Oil Industry
Tags: acreage, biodiesel, biodiversity, biomass, Capacity, crude palm kernel oil (CPKO), crude palm oil (CPO), development, export, finished products, food products, fresh fruit bunch (FFB), import, incentives, industrial, IOI Corporation, Kuala Lumpur Kepong KLK, Malaysia, oil extraction rate (OER), oils and fats, oleochemicals, palm kernel cake (PKC), palm kernel oil (PKO), palm oil, performance, plantation, prices, processing, production, revenue, Roundtable on Sustainable Palm Oil (RSPO), Sime Darby SIME, stock, sustainable palm oil, tax, utilisation rate, yield
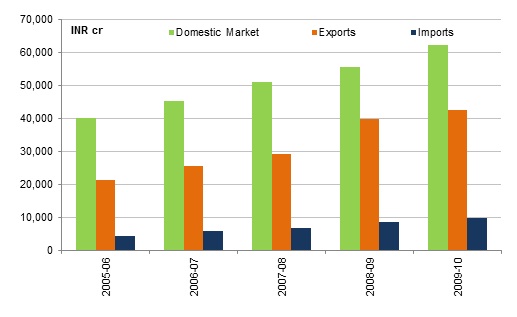
India Pharmaceutical & Healthcare provides an overview of the industry in Asia Pacific and India. India’s pharmaceutical industry grew by 9.7% year-on-year in 2009-10, largely due to robust growth in its domestic market. India’s healthcare industry is expected to grow 14% per year to reach USD 280 billion by 2020. Exports of drugs, pharmaceuticals and fine chemicals accounted for approximately 4.20% of the total national exports in 2010-11.
The report includes the market trends and outlook for the pharmaceutical and healthcare industries in India. We examine the country’s generic production, healthcare equipment, government schemes, TRIPS Compatibility, R&D initiatives, Pharmaceutical Export Promotion Council and India’s Vision 2015.
Also, the report encompasses the profile of leading players in the industry as well as their financial highlights and SWOT analysis. Among the leading players are Ranbaxy, Dr Reddy’s, Cipla and Lupin. Ranbaxy is India’s largest pharmaceutical company with operations in 23 of the top 25 pharmaceutical markets of the world.
Key Findings
- India’s pharmaceutical industry grew by 9.7% year-on-year in 2009-10, largely due to robust growth in the domestic market.
- India’s healthcare industry is expected to grow 14% per year to reach USD 280 billion by 2020.
- According to government statistics, exports of drugs, pharmaceuticals and fine chemicals throughout 2010-11 stood at INR 47,551 cr after a robust growth of 12.0% over 2009-2010.
India Pharmaceutical Sector
Source: Department of Pharmaceuticals
These are only a few of the insights in the new EMD Report : India Pharmaceutical Industry. Learn more and purchase now>>
Tags: Asia-Pacific, Bengal Chemicals and Pharmaceuticals, Bengal Immunity, bulk drugs, Cipla, Dr Reddy’s, drug prices, equipment, export, FDI, FICCI, formulation packs, GDP, generic drug, government schemes, health statistics, healthcare, Hindustan Antibiotics, import, India, Indian Drug and Pharmaceuticals, investments, Lupin, medicinal, NIPER, NPPA, patent, pharmaceutical, pharmaceutical trade, pharmaceutical units, Pharmexcil, PSU, public sector undertakings, R&D initiatives, Ranbaxy, Smith Stanistreet Pharmaceuticals, TRIPS, US FDA
The paper industry in India has been in existence since ancient times, experiencing a paradigm change over the years. The existing paper mills in the country employ diverse technologies- from legacy to advanced methods. The mills use a variety of raw materials including wood/chemical pulp, agro residues and recycled fibre to produce paper and paper products.
While the demand for paper remained subdued in the developed world during 2009-12, the Indian paper and paper products sector saw a rapid growth. The sector saw consistent growth in consumption and increased production. This trend motivated the paper manufacturers in the country to implement capacity expansion and growth plans.
Following rapid consumption growth experienced in the past few years, the Indian paper industry experienced a lull in FY13; for that matter, most sectors of the Indian economy experienced a slowdown during this period. High inflation was a deterrent for consumption. Furthermore, rising raw material prices forced the manufacturers to increase the price of paper, temporarily forcing players in the industry to rethink their growth strategy. Some deferred their expansion plans, while others scaled down their operations.
However, the long term outlook for Indian paper sector is stable because of existing low per capita paper consumption, rising literacy rate and a young population. Government support and technology upgrades will further add to the growth of this sector.
Salient Points
- India experienced a rapid growth in consumption of paper and paper products during the period 2009-12. During this period the consumption grew at a CAGR of 8.5% which was much higher than the average global growth rate of less than 3%. However demand experienced a slowdown during the first nine months of FY13.
- However, India only consumed 2% of the world’s paper production as of FY12, a low figure for a country which holds 15% of world’s population.
- The total paper and paper product exports from India grew at a CAGR of 12.4% in value terms during the period 2007-12. Paper exports accounted for 0.7% of the total exports of India as of 1HFY13.
- In 9MFY13, the paper and paper product index grew only by 0.7%, much below the growth it registered in last five years.
Chart: Y/Y growth in production index-Paper & Paper Products

Source: MOSPI
This is just a quick glimpse into the EMD Report: India Paper & Paper Products Industry. Learn more and purchase now>>
Tags: Bagasse, Ballarpur Industries Ltd (BILT), Capacity, coal, Consumption, export, import, Index of Industrial Production (IIP), Indian Paper Manufacturers Association (IPMA), Mills, Newsprint, Paperboard, Per capita, Printing paper, production, Pulp, Rainbow Papers Ltd (RPL), Recycled, Tamil Nadu Newsprint and Paper Ltd (TNNPL), Wood, Writing paper
The European Bank for Reconstruction and Development (EBRD) passed a negative economic growth outlook for kraine for both 2012 and 2013 citing faster decline in industrial production in the last two quarter of 2012. In its latest Regional Economic Prospects Report published in January, the EBRD said it expects Ukraine’s economy to post a zero growth in 2012 and expand by 1% in 2013, cutting its forecasts from earlier expected growth of 1% and 2.5%, respectively. Ukraine’s industrial production in 2012 contracted by 1.8% from 2011 with the annual fall in December deepening to 7.6% from 3.7% in November, according to data from the State Statistics Service. Agricultural production is no exception, declining by 4.5% y/y in 2012 versus a 19.9% growth in 2011. Crop production last year fell by an annual 8.2%, with commercial farms’ production going down by 10.9% and that of private farms decreasing by 4.6%, – animal goods’ production, on the other hand increased by 3.8%. Specifically, output of commercial farms was higher by 7.6% and of private farms by 1.2%. According to
preliminary data, the strongest annual output growth was registered in Khmelnytsky (+12.9%), Ternopil (+9.8%) and Kyiv (+9%) regions, while the steepest decline was reported in the regions of Dnipropetrovsk (-20.3%),
Zaporizhzhia (-19.2%) and Odesa (-19.1%).

Much more in the Intellinews report: Ukraine Food Sector Report
Tags: agriculture, alcohol, Alcohol Traditions, Avangard, bakery, beer, beverages, Biscuit-Chocolate, bread, caramel, cheese, Chumak, dairy, EBRD, EconMin, export, fish, flavoring, food, fruits, Global Spirits, Globino, government, grain, import, investment, Konti, Kremenchukmiaso, Kyiv, loss, meat, milk, Milkiland, Nestle, Panda, production, profit, Roshen, Stable, sugar, Svarog West Group, Ukraine, Ukrmolprom, vegetables, Vodka, wheat, wine, Zhytomyrski Lasoschi
Romania’s largest export item is visibly scrap [2.35mn tonnes in 2011, yet 22% down y/y to 1mn tonnes in 1H 2012], when it comes to either volume or value. But excluding scrap, is not really an output item of local steel industry, other major export items are flat, hot rolled goods [hot rolled flats] and the un-welded pipes, tubes, tubular products. The hot rolled flats accounted for nearly half of the exports in 2007 [see chart below], but werereduced by more than two times, accounting for roughly one fifth in 2011; in H1 of 2012, hot rolled flats accounted for some one quarter of total exports. Among the items with positive dynamics are pipes and particularly bars [rods] – with the latter rising from virtually zero to 7.4% of exports in 1H 2012.
This is just a quick glimpse into the Intellinews Report: Romania Iron and Steel Report. Learn more and purchase now>>
Tags: Arcelormittal, Bamesa Otel, development, export, forecast, foreign trade, import, industry, iron, market, MECHEL, prices, production, Romania, sales, Steel, TMK Artrom, utilization, Voestalpine


